Chart Controls
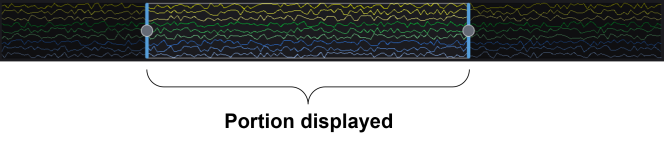
Data Preview Bar
The Data Preview Bar gives a visual indication of the portion of the trace is currently displayed in the chart. The area within the blue vertical lines is the portion of the trace that is currently displayed.
Trace Display Toolbar
Use the Trace Display toolbar to zoom in/out and auto scale the displayed data. Click the Start Data Logger button to start data logging.
Icons

|
Zoom in horizontally. |

|
Zoom out horizontally. |

|
Auto scale the trace on both the x- and y-axis. |

|
Auto scale the trace on the vertical axis (y-axis). |

|
Auto scale the trace on the horizontal axis (x-axis). |

|
Automatically scroll new trace data from the right side of chart. |